

Key takeaways
- The three core valuation approaches are income, sales comparison and cost. Select and reconcile the approaches that fit the property and available evidence.
- Direct capitalization divides an appropriate annual NOI by a supported cap rate. A discounted cash-flow model values a series of operating cash flows and net sale proceeds.
- Label the valuation date, property interest and income period. Future exit proceeds and present property value are different amounts.
- Price per square foot, price per unit and gross rent multipliers can help compare properties, but they need adjustments for differences in income, condition and lease terms.
To value commercial property, start with the income it can support, evidence from comparable transactions and the cost of its land and improvements. The weight each approach deserves depends on the asset and the purpose of the valuation.
For a leased building, the rent roll and expense forecast often drive the analysis. A vacant development site or a specialized facility may require a different emphasis. In every case, identify what interest is being valued and as of which date.
Market conditions provide context, but property-specific evidence matters. A new lease, a major repair or an approaching lease expiration can change the cash-flow forecast even when market averages are stable.
This guide explains the main approaches and uses a hypothetical industrial property to show direct capitalization, exit-cap sensitivity and discounted cash flow.
How to value commercial property in five steps
- Gather the file. Rent roll, leases, the last two years of operating statements, real estate tax and insurance bills, utility bills, capex history, title, and a survey. The appraiser and the credit memo will both ask for the same set.
- Build NOI. Effective gross income (scheduled rent less vacancy and credit loss, plus other income) minus operating expenses. Leave out debt service, income tax, depreciation, and capital items. Decide which year sits in the numerator: trailing, in-place, or forward.
- Choose applicable approaches. Consider income for investment property, adjusted sales evidence where comparable transactions exist, and cost where it provides a useful indication. Explain why an approach receives more or less weight.
- Calculate the value indication. For direct capitalization, divide annual NOI by a supported cap rate. For discounted cash flow, forecast operating cash flows and net sale proceeds and discount them at an appropriate rate.
- Reconcile the evidence and test assumptions. Compare the indications, investigate differences and show sensitivity to income, expenses, capital needs and valuation rates.
Keep the supporting records and assumptions with the valuation so another reviewer can follow the result.
The three core valuation approaches
For federally related transactions requiring an appraisal, 12 U.S.C. 3339 provides the framework for federal appraisal standards. The Interagency Appraisal and Evaluation Guidelines discuss income, sales comparison and cost, including the need to use applicable approaches and explain omissions.
The appropriate scope depends on the assignment and regulatory requirements. An appraiser reconciles the relevant evidence into a value opinion; the process does not require mechanically averaging three numbers.
The OCC’s minimum appraisal standards address written, USPAP-compliant appraisals by state-licensed or certified appraisers for covered transactions. A sponsor’s acquisition model or broker opinion serves a different purpose and may not satisfy a lender’s appraisal requirement.
Income approach. Direct capitalization converts one year of NOI into value using an overall cap rate. Discounted cash flow projects income, capital outlays and net sale proceeds over a holding period and discounts those cash flows to the valuation date. The cap rate and discount rate perform different jobs.
For property NOI, deduct operating expenses from effective gross income. Debt service, income tax, depreciation and capital expenditures are generally excluded. In a cash-flow model, include capital and leasing costs separately so they are reflected in value without being confused with operating expenses.
Sales comparison approach. Analyze closed transactions involving comparable properties and adjust for market timing, location, condition, size, tenancy and the rights conveyed. Price per square foot or per unit provides a consistent comparison measure, but the adjustment work supports the conclusion.
Cost approach. Estimate land value plus the current replacement or reproduction cost of improvements, less applicable physical deterioration and functional or external obsolescence. It can be especially informative for newer or specialized properties, although estimating depreciation and market demand requires judgment.
The OCC commercial real estate handbook places valuation alongside property cash flow and financing risk. Choose an approach because it provides relevant evidence for the assignment, rather than because it produces the preferred number.
The following comparison summarizes the inputs and limitations:
| Approach | When useful | Data needed | Weakness |
| Income | Tenant-occupied, stabilized, or stabilizable | Rent roll, leases, expenses, vacancy, cap or yield rate | Sensitive to income, capital costs and rate assumptions |
| Sales comparison | Liquid markets with recent closed comps | Closed sales, adjustments, units of comparison | Limited or poorly matched sales can weaken reliability |
| Cost | New construction or special-purpose | Land value, replacement cost, depreciation | Depreciation and market obsolescence can be difficult to estimate |
For a stabilized rental property, income analysis may carry substantial weight, with adjusted sales as a cross-check. For a new or specialized building, cost evidence may be more useful. The absence of good comparables does not make construction cost equal to market value.
The San Francisco Chronicle reported in September 2026 that Disney was leasing space at One Market Plaza after Google’s departure. A leasing event like this is relevant to valuation because the new agreement’s rent, concessions, improvement costs and commencement date determine its contribution to cash flow. A headline about tenant demand alone does not supply those inputs.
Going-in cap versus terminal cap
A going-in cap rate relates annual property NOI to the purchase price or current value. State whether the income is trailing, current annualized or forward-looking. It is a property-level measure before financing; cash-on-cash return instead relates cash available to equity with the relevant equity investment.
A terminal cap rate converts an income estimate into a future gross sale value. A common convention uses the year immediately after the modeled sale. Deduct selling costs and any other relevant exit adjustments, then discount the resulting proceeds when calculating present value.
The entry and terminal rates may be equal, but that should be a supported assumption. Consider changes in lease duration, property condition, growth expectations and the exit market. Keep the NOI convention consistent with the rate evidence.
The Federal Reserve’s May 2026 Financial Stability Report described further stabilization in CRE prices and cap rates above their 2022 lows. That broad assessment provides context; selecting a rate for an individual asset still requires relevant market transactions and property analysis.
Worked example: Value an industrial property
Assume a hypothetical stabilized industrial property has $2.1 million of forward year-one NOI. If relevant market evidence supports a 6.25% entry cap rate, direct capitalization gives:
Value = $2,100,000 / 0.0625 = $33,600,000
Now assume a seven-year hold and 2.5% annual NOI growth. Year-one NOI is $2.1 million, so year-seven NOI has six growth periods and is about $2,435,356. For a sale at the end of year seven, this example capitalizes forward year-eight NOI: $2,100,000 × 1.025^7 = $2,496,240.08.
Gross sale values at the end of year seven, using unrounded year-eight NOI, are:
- At 6.25 percent: $2,496,240 / 0.0625 = $39,939,841
- At 6.75 percent: $2,496,240 / 0.0675 = $36,981,335
- At 7.25 percent: $2,496,240 / 0.0725 = $34,430,898
The 6.25% and 7.25% terminal-cap scenarios differ by about $5.51 million in future gross sale value. These figures share the same projected income path and exclude selling costs. They are not present-day values.

To compare outcomes today, deduct exit costs and discount the proceeds to the valuation date. Also test the income path: lower rent or occupancy can affect both operating cash flow during the hold and the income capitalized at exit.
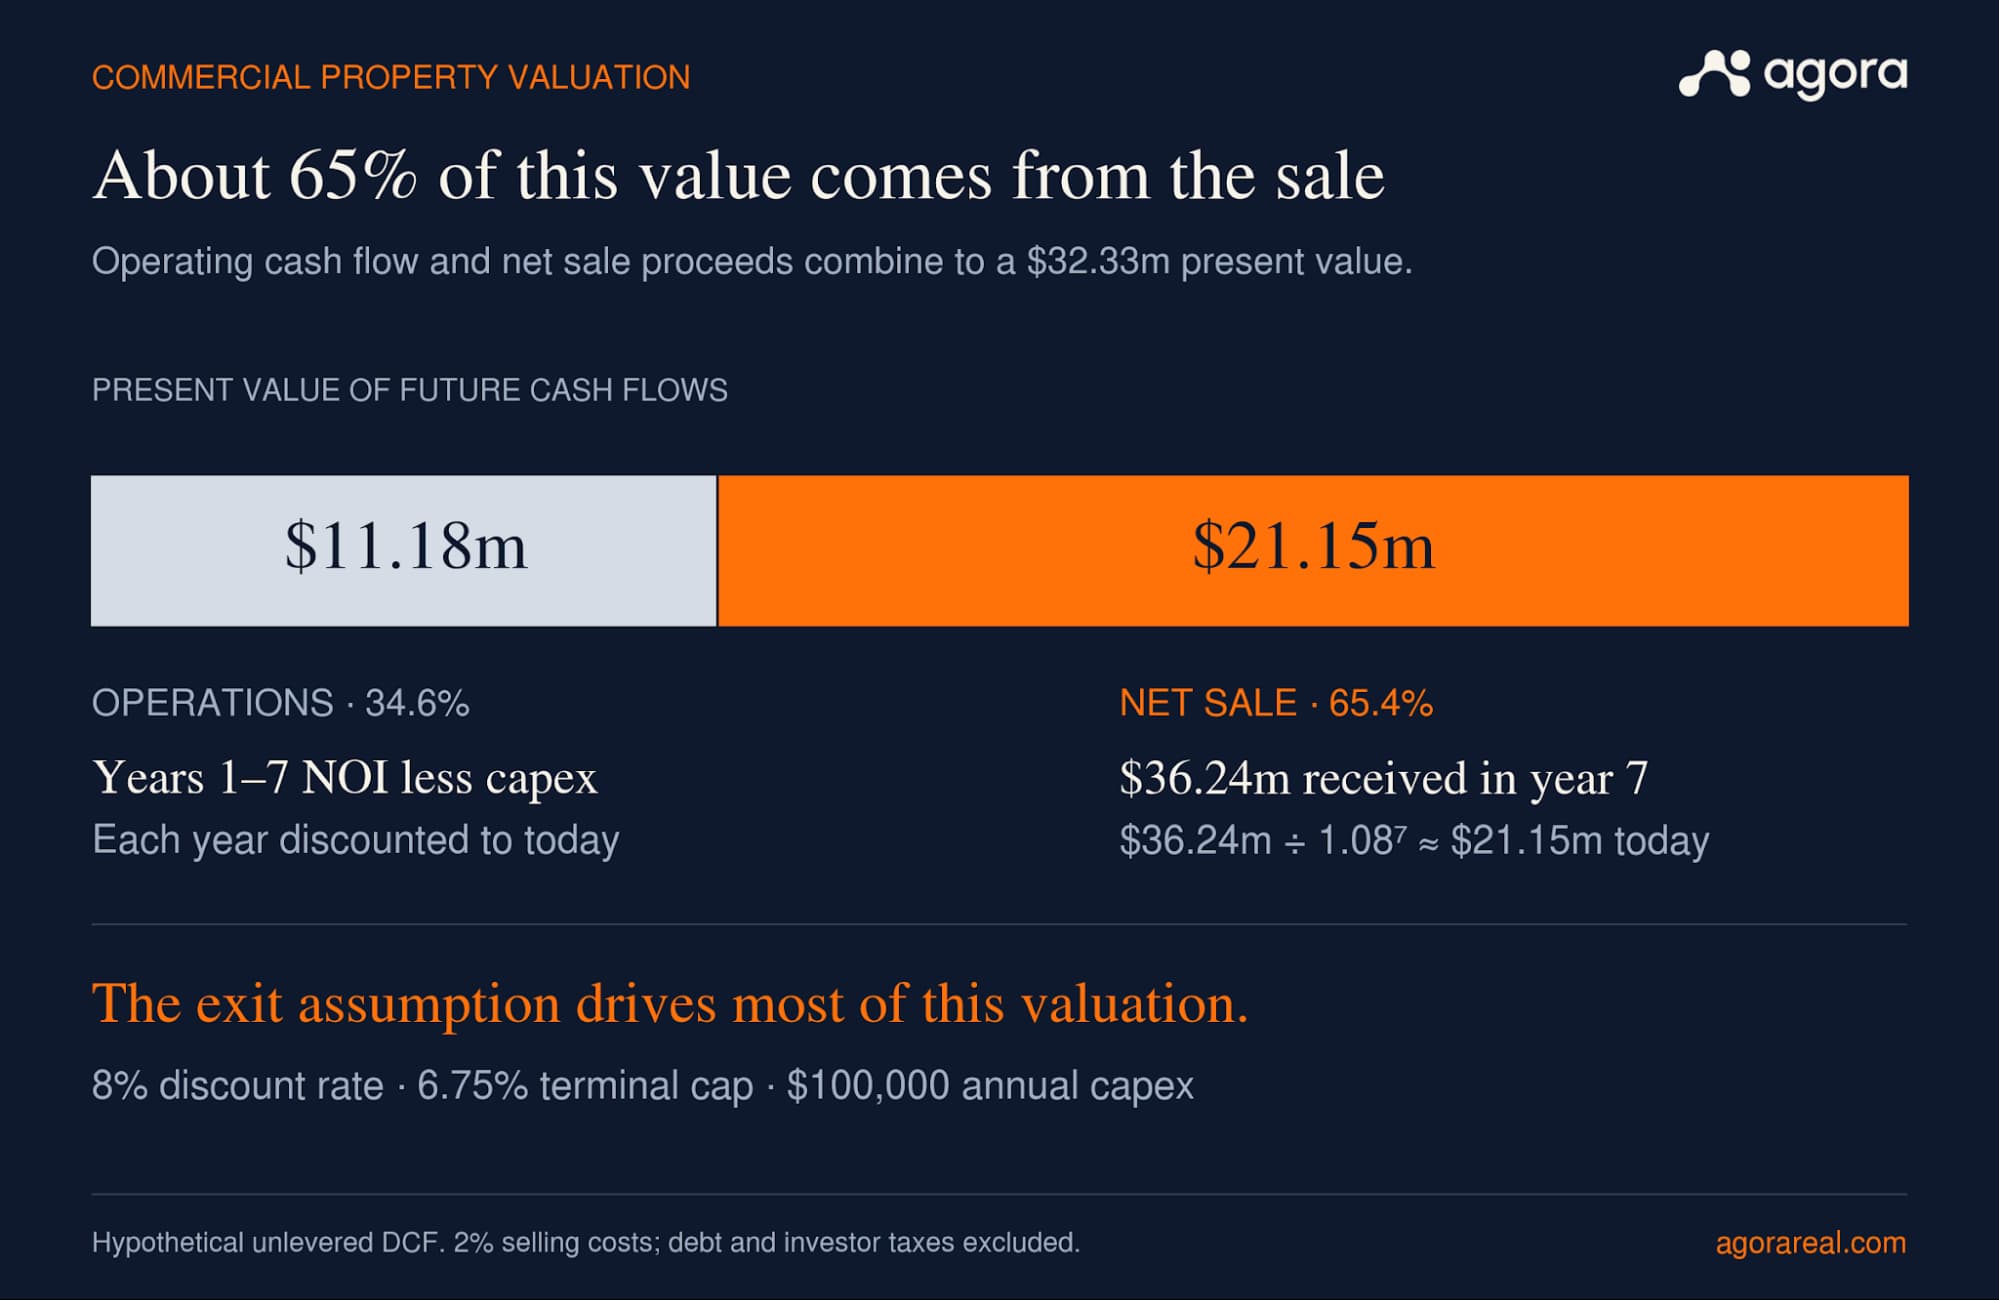
For a simplified unlevered DCF, assume $100,000 of annual capital spending, 2% selling costs, an 8% discount rate and a 6.75% terminal cap. With each year’s operating cash flow received at year-end, value equals the present value of seven years of NOI less capital spending, plus the present value of net sale proceeds. Under these assumptions, the indication is approximately $32.33 million. Debt and investor-level taxes are excluded. The discount rate is illustrative, not a current market recommendation.
How much value depends on the sale?
About 65.4% of this DCF’s $32.33 million indication comes from the discounted net sale proceeds. The seven years of operating cash flow contribute the remaining 34.6%. A detailed annual forecast can therefore still depend heavily on the price a buyer is expected to pay at exit.
Show that split when presenting the valuation, and test terminal NOI and the exit cap rate together. If the proposed purchase price only works with a tighter exit cap, identify the property or market changes expected to support it and show the result without that compression. The Fed’s broad market figures provide context for that assumption, not a forecast of this property’s sale price.
Cap-rate sensitivity on current NOI
Value equals NOI divided by cap rate. On $2,100,000 of year-one NOI:
| Cap rate | Value | Change vs 6.25 percent |
| 5.50% | $38,181,818 | +$4,581,818 |
| 5.75% | $36,521,739 | +$2,921,739 |
| 6.00% | $35,000,000 | +$1,400,000 |
| 6.25% | $33,600,000 | Base |
| 6.50% | $32,307,692 | ($1,292,308) |
| 6.75% | $31,111,111 | ($2,488,889) |
| 7.00% | $30,000,000 | ($3,600,000) |
| 7.50% | $28,000,000 | ($5,600,000) |
| 8.00% | $26,250,000 | ($7,350,000) |
At $2.1 million of NOI, increasing the cap rate from 6.25% to 6.50% lowers the indication by about $1.29 million. The dollar effect of another 25-basis-point change would differ because value is inversely related to the rate.
Financing should be tested separately against the supported value and cash flow. See DSCR loans and commercial real estate underwriting for those calculations.
Using multipliers and unit prices as cross-checks
Gross rent multipliers, price per square foot and price per unit provide quick comparisons. Use consistent definitions and adjust for property differences before relying on the result.
| Technique or comparison | Formula | Where it sits |
| Direct capitalization | NOI / cap rate | Income approach |
| Discounted cash flow | Present value of operating cash flows and net sale proceeds | Income approach |
| Gross rent multiplier | Comp price / comp gross annual rent, then GRM x subject gross rent | Income-related comparison using market transactions |
| Price per square foot | Comp price / comp area, then x subject area | Sales-comparison unit |
| Price per unit (per door) | Comp price / units, then x subject units | Sales-comparison unit |
| Cost | Land value + replacement cost of improvements – depreciation | Cost approach |
| Residual land value | Completed value less development costs, finance costs and required profit | Development screen |
For a hypothetical gross-rent comparison, assume the subject earns $2.75 million annually. A comparable property sold for $30 million with $2.4 million of annual gross rent, giving a 12.5x multiplier. Applying it to the subject produces $34.375 million before adjustments. That is reasonably close to the $33.6 million direct-cap indication, but the comparison needs further support.
A gross rent multiplier does not directly account for operating expenses. Specify whether the rent measure is scheduled or collected and whether it is annual or monthly. Similar gross rent can support different NOI when vacancy and expense ratios differ.
For price per square foot, match the area convention and adjust for location, building condition, lease terms and transaction date. Multiplying an unadjusted market average by the subject’s area can conceal material differences.
Price per unit applies the same principle to multifamily. A 100-unit building at $200,000 per unit indicates $20 million before adjustments, but unit size, condition, rent and expense differences still need review.
A residual land-value analysis starts with completed development value and deducts development, financing and other relevant costs plus required profit. Account for timing and risk consistently. It helps estimate what a project can support for land, subject to the feasibility of the plan.
An automated valuation estimate may support screening, but it does not by itself satisfy every appraisal requirement. The interagency guidelines distinguish an AVM output from an appraisal completed in accordance with the applicable standards.
Common commercial valuation mistakes
- Leaving the terminal cap untested. Show a supported base case and alternatives that reflect the property and market risks at exit.
- Mixing trailing and forward NOI. Incorporate known lease changes, vacancy, tax reassessment and other relevant adjustments, and label the income period in the underwriting.
- Using unadjusted comparisons. Check the transaction date, rights conveyed, condition, tenancy and area or unit definition.
- Treating replacement cost as a universal ceiling or floor. Market value also reflects income, demand, scarcity and obsolescence.
- Omitting costs. Include operating expenses in NOI and capital, leasing and selling costs in the appropriate cash-flow periods. Avoid counting an item twice.
- Reporting an unexplained value change. Keep the offering documents, model and investor communications consistent about the valuation date, basis and source.
Document and communicate valuation changes
A valuation is a dated conclusion based on specified information. Record its purpose, assumptions, source evidence and any material limitations. When the reported value changes, explain whether the cause is operating performance, a transaction, a new appraisal or a revised market assumption.
Agora’s investor portal provides a place to share investment information and documents with investors. Pair reported values with a clear explanation of their basis and the relevant supporting report.
Keep estimated value separate from cash distributions and realized returns. An increase in reported property value does not mean that cash has been paid to investors.
Conclusion
Commercial property valuation combines an appropriate approach with reliable inputs and a clear valuation date. Income, comparable sales and cost can each contribute evidence, while simple multipliers help cross-check the result.
The industrial example shows how income timing and terminal rates affect the calculation. Verify the cash-flow periods, include relevant costs and test alternative assumptions before relying on a single value.